Quick Start Guide
Quick-Start Guide
- Go to the ELAT workbench on Google Chrome (it’s highly recommended that you close other tabs on your Chrome browser, as well as other applications on your computer) .
- Click on Upload Files to show 2 upload fields, one for Metadata and one for Logfiles
- Upload all metadata files for a single course, this should take a minute or less. Reload the page when prompted.
- Upload all the logfiles (named something like university-edx-events-2014-10-25.log.gz) between the starting and ending dates of the course, this will take around 2 to 3 hours. Once the process starts, you can leave it working. Reload the page when prompted.
- Some main indicators and plots will be generated in the page, it will take a few minutes the first time.
- The processed tables can be obtained in csv format for further analysis with the download buttons.
- (Optional) After obtaining the csv files, it is possible to delete the database by pressing the Clear Database button at the bottom. This allows to repeat the process for another course.
Step-by-Step Detail:
(images may change as prototype is reviewed)
1. Workbench Home (Describe Course Details and Database Details)
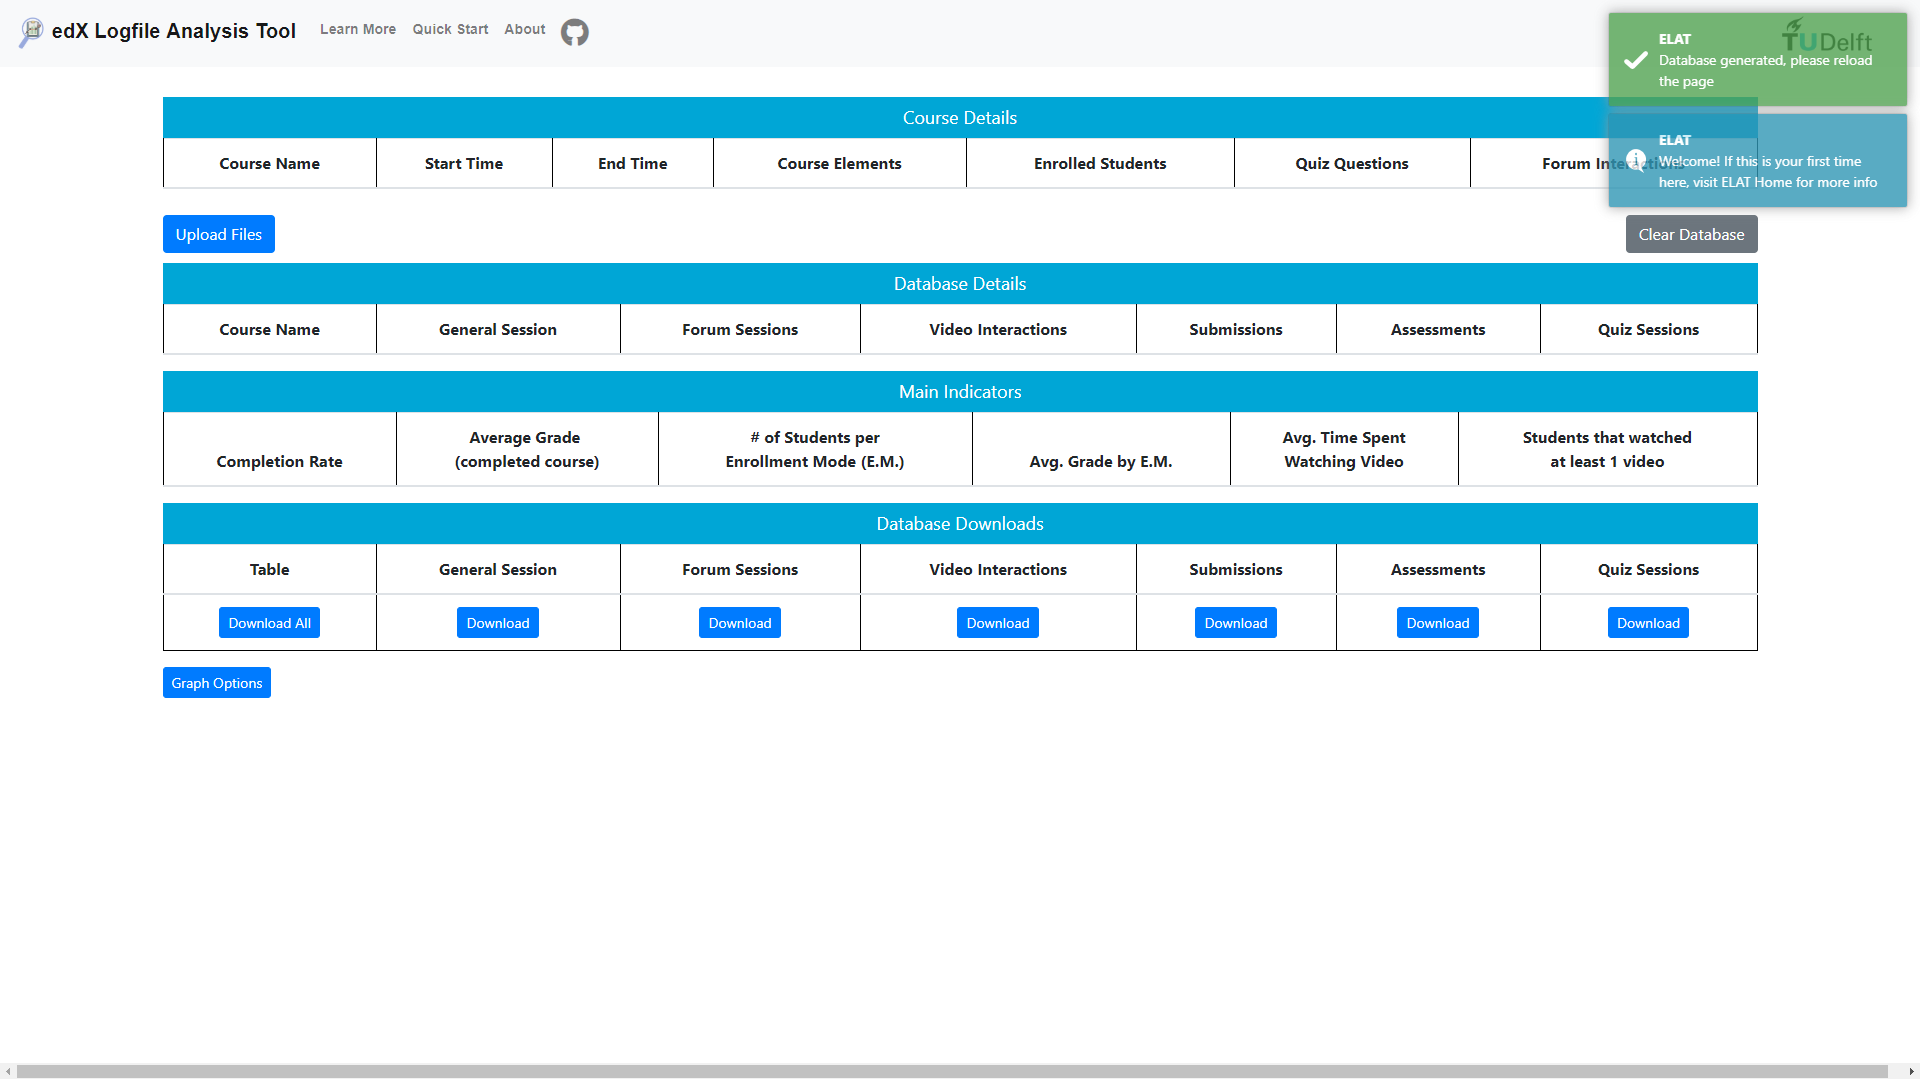
On the first visit to ELAT, a database will be created in the browser’s IndexedDB, and a message will appear (as shown in the picture below)
2. Upload Files
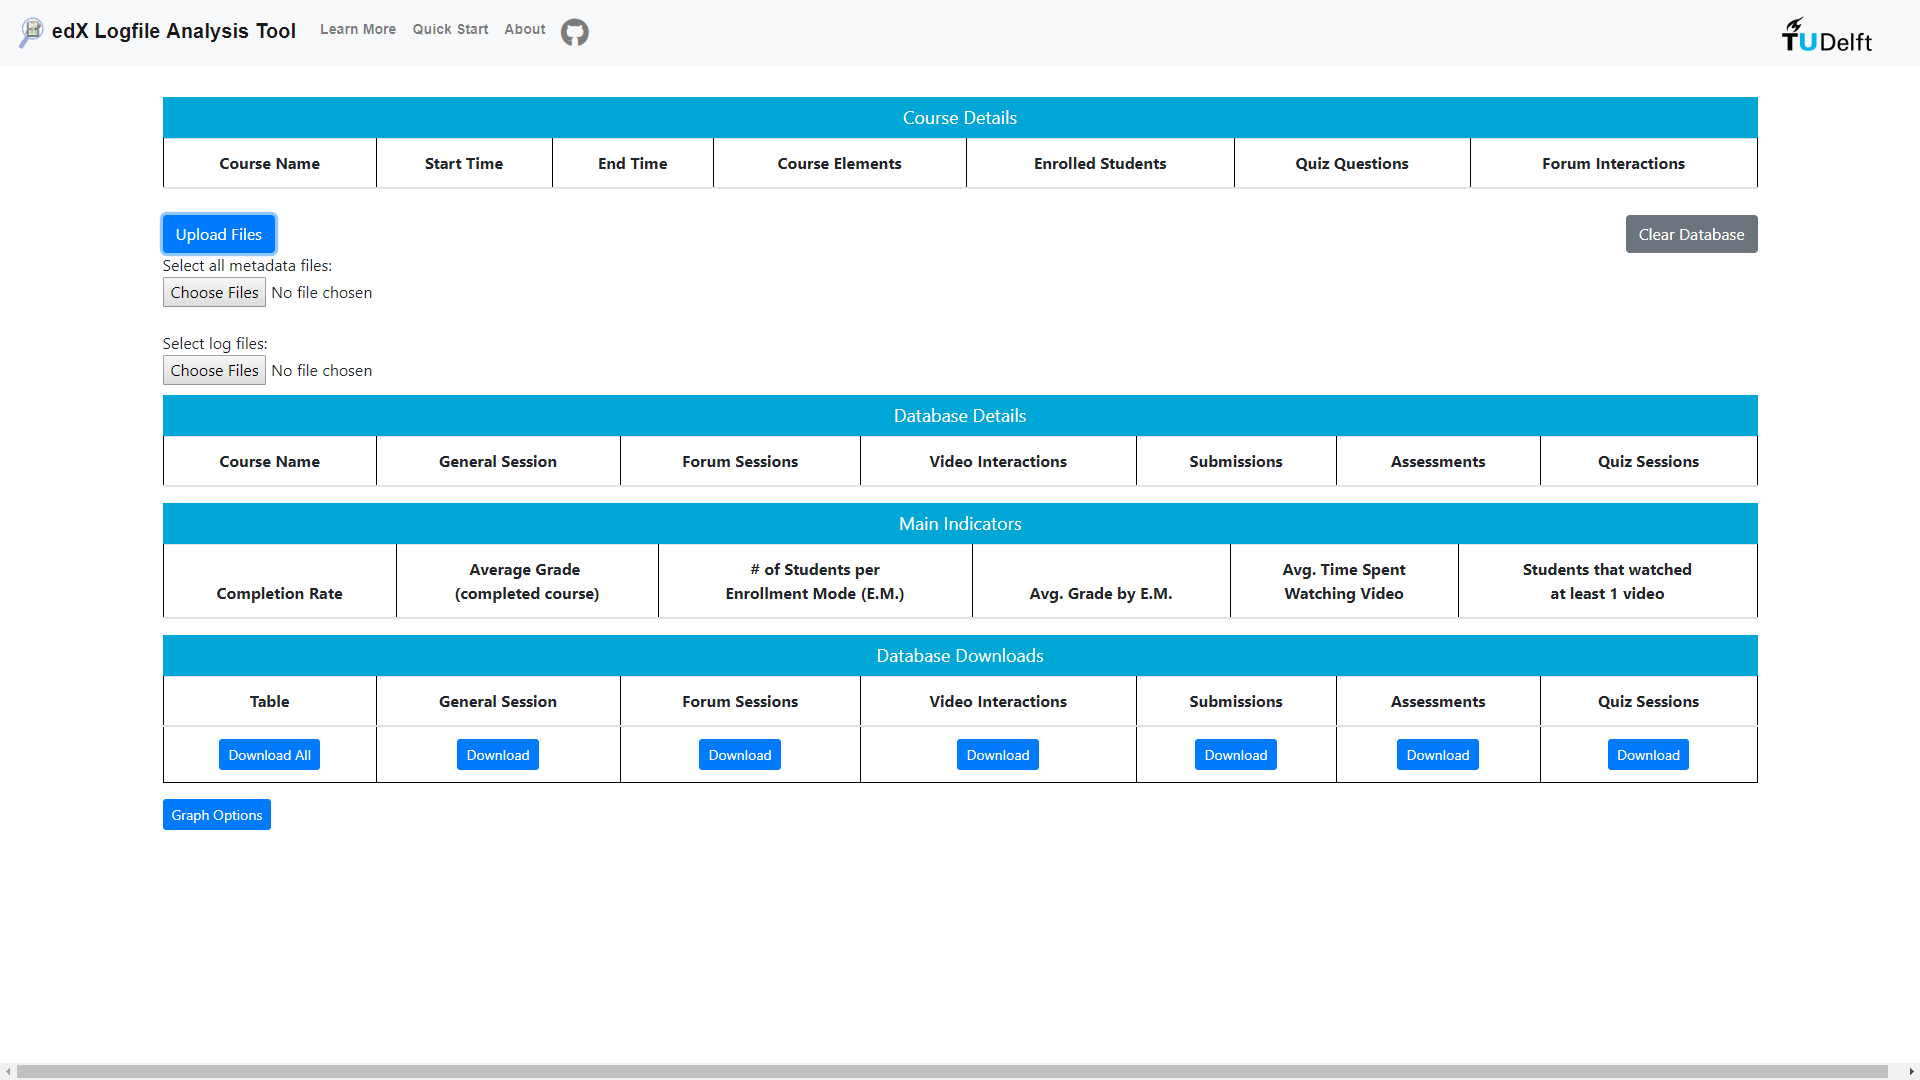
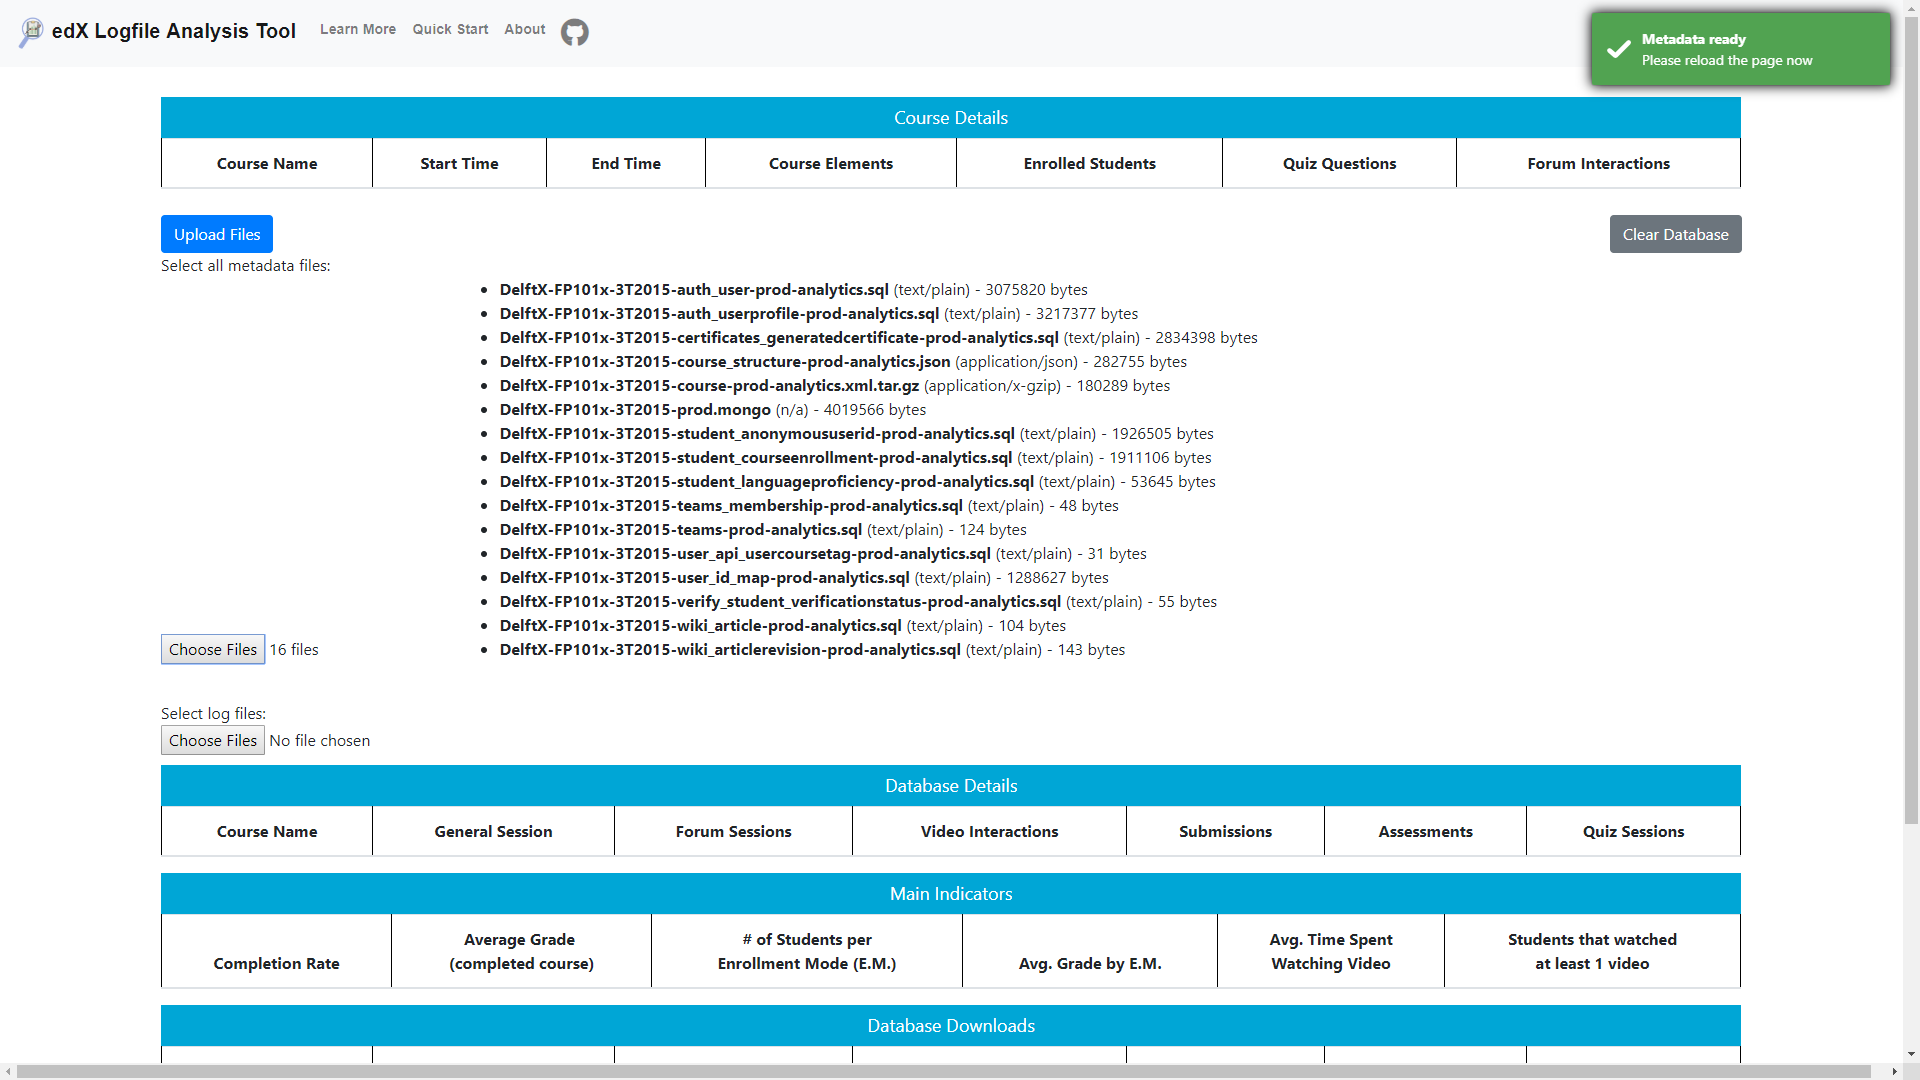
By clicking the button ‘Upload Files’, two file managers will appear, one for metadata and one for logs. Metadata goes first, since it contains all the course information: course id, component ids, students, etc.
3. Metadata
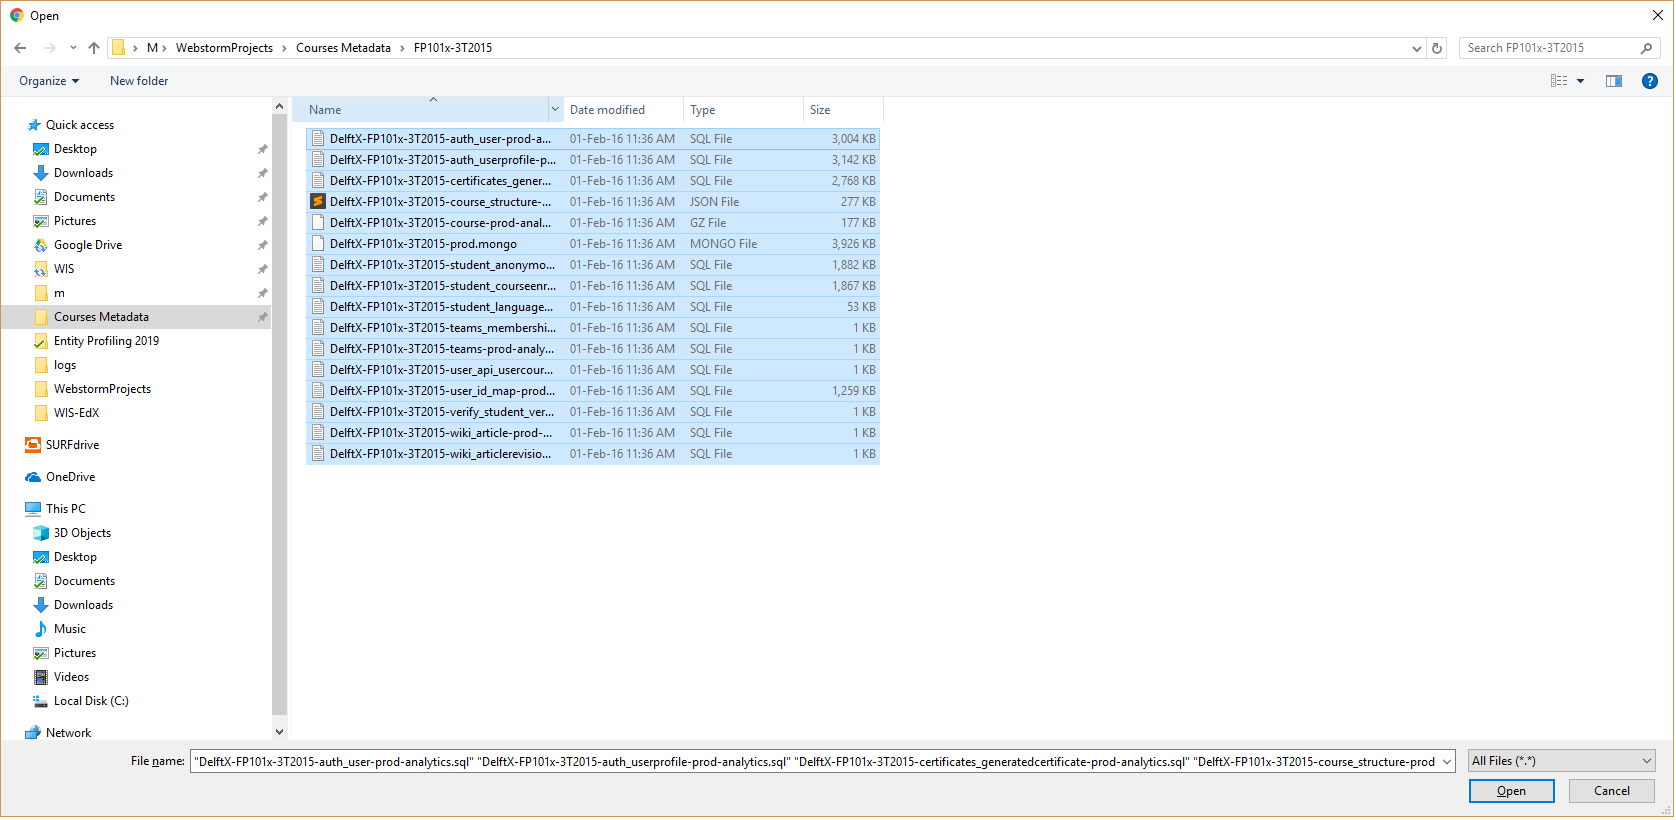
ELAT needs ALL the metadata files to work correctly: auth_user-prod-analytics.sql, auth_userprofile-prod-analytics.sql, certificates_generatedcertificate-prod-analytics.sql, course_structure-prod-analytics.json, etc. Don’t worry about formats or names, just upload all the metadata files for a single course.
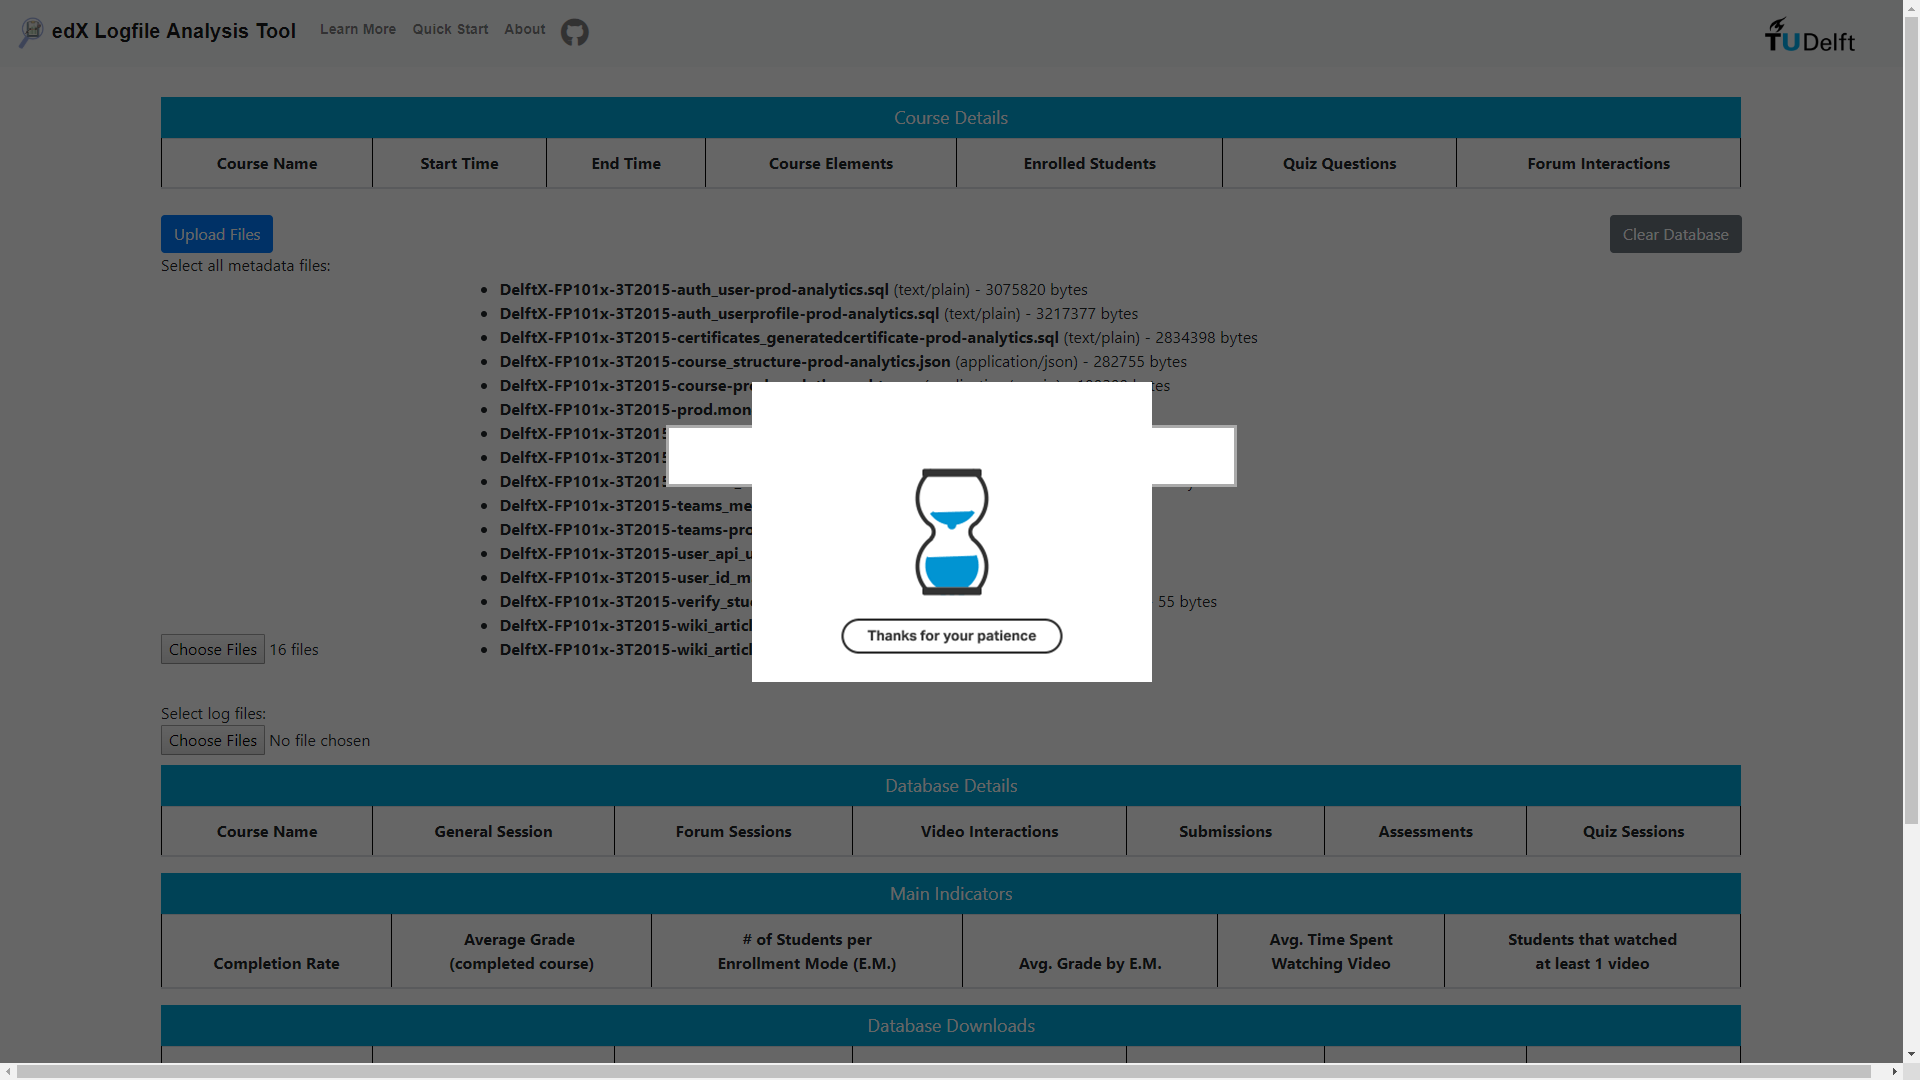 Once ELAT is finished with the metadata processing, reload the page.
3a. Metadata Indicators
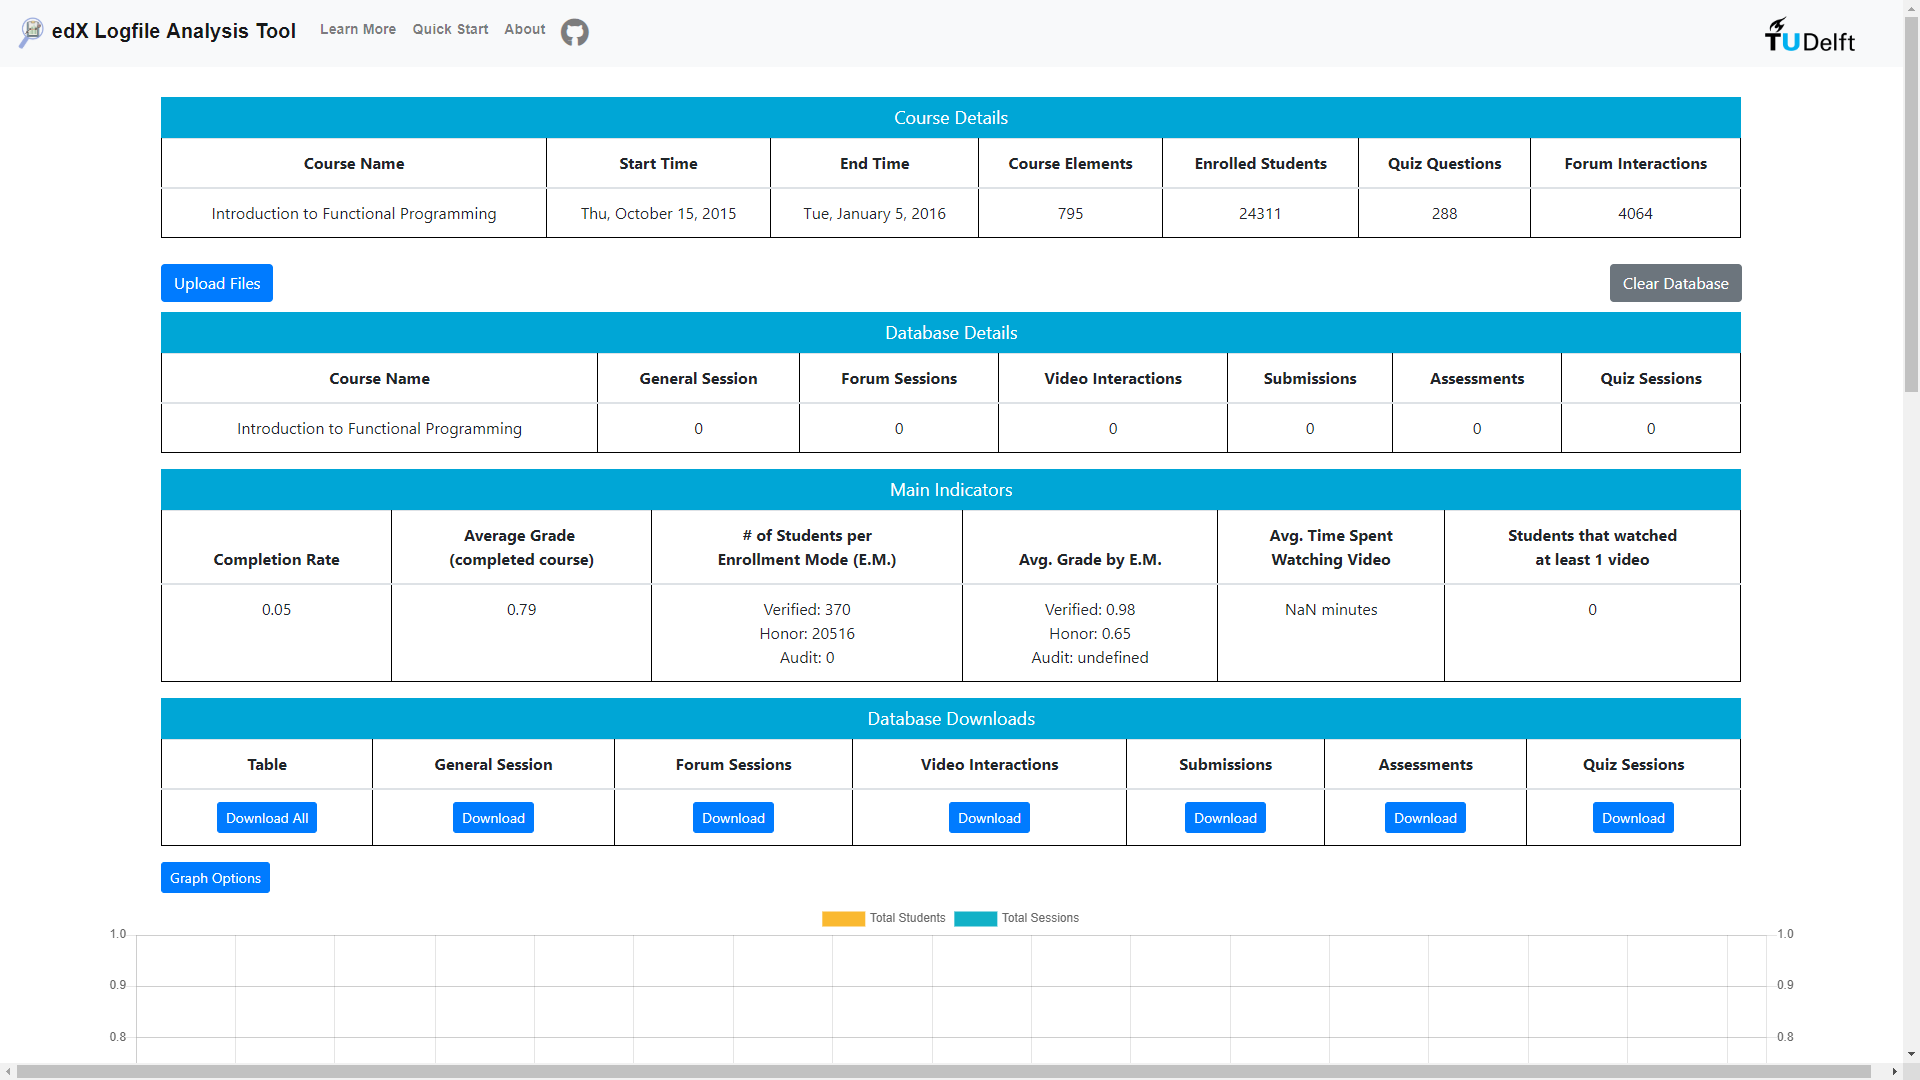
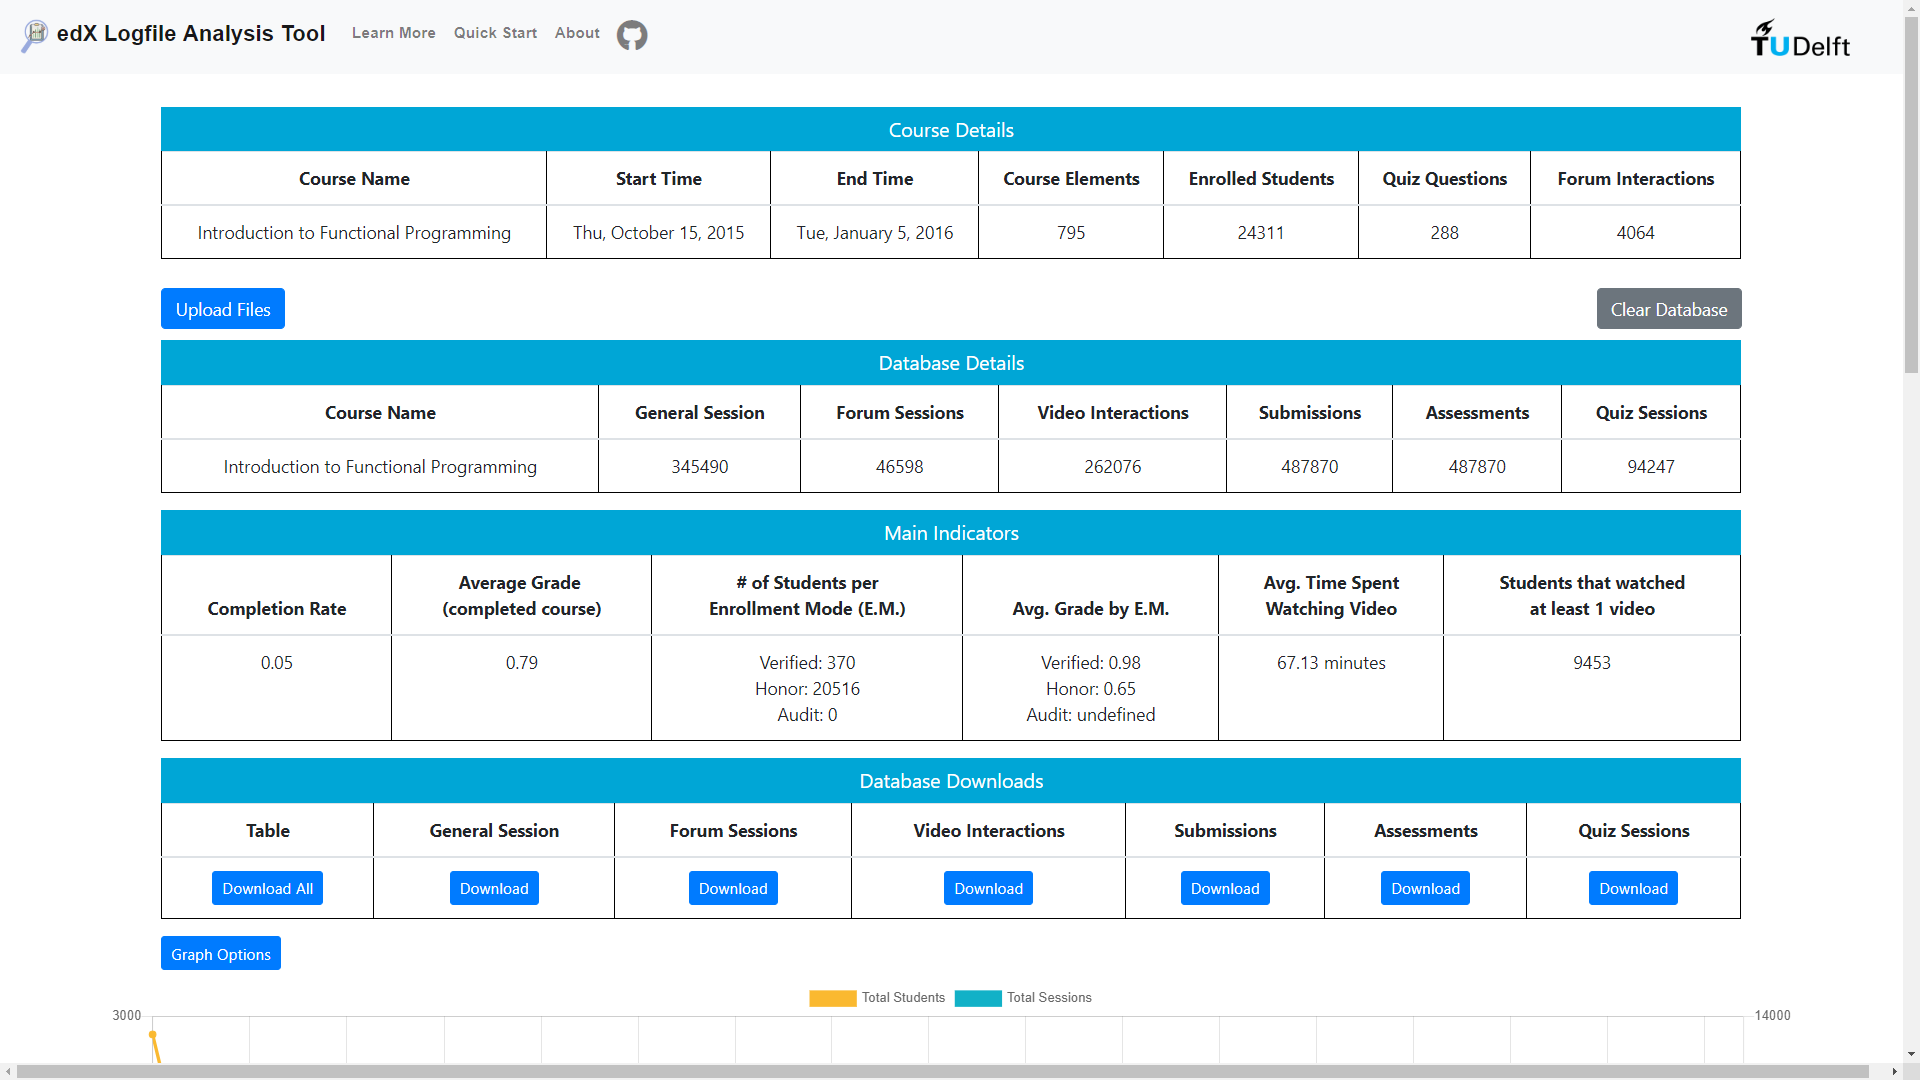
The first indicators will appear in the dashboard, in the Course Indicators table. Course Name, Start and End Time, Course Elements (all the components of the course: videos, quizzes, assessments, etc.), Quiz Questions (all individiual questions existing in the couse) and Forum Interactions (the count of all posts and comments in the Forum of the cousrse).
The values that can be obtained from metadata will appear in the Main Indicators table, Completion Rate (students that finish the course), Average Grade (for students that completed the course) Number of Students per Enrolment Mode (only with completed course), and their Average Grades per EM. The Time Spent on Video and Students that Watched at Least one Video require the logfile data, so they will not be filled yet.
4. Logfiles
Similar to metadata, press the ‘Upload Files’ button, then under ‘Select log files’, and select all log files corresponding to the course. For example FP101x runs from October 15, 2015 to January 5, 2016. In the image below you can see that 83 files were uploaded.
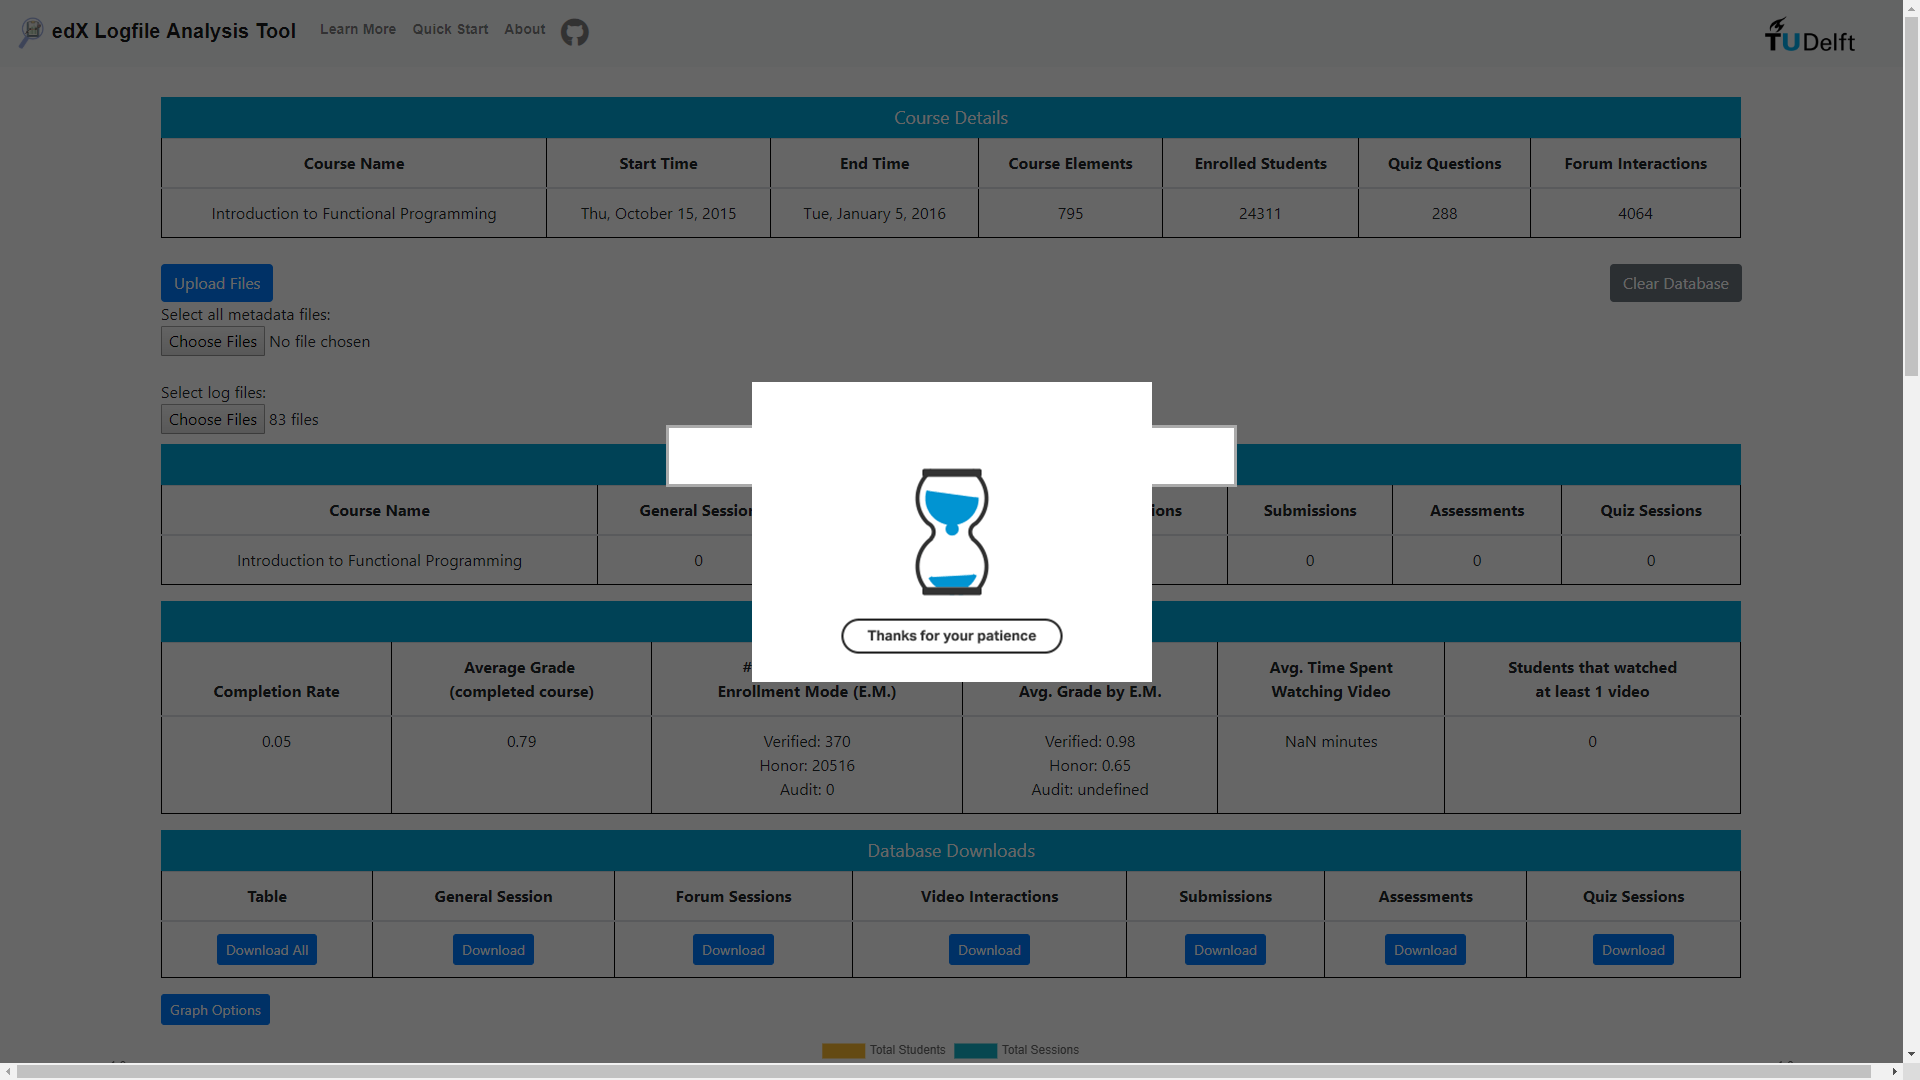 This step can take a few hours. It is recommended to close other tabs on the browser and other applications.
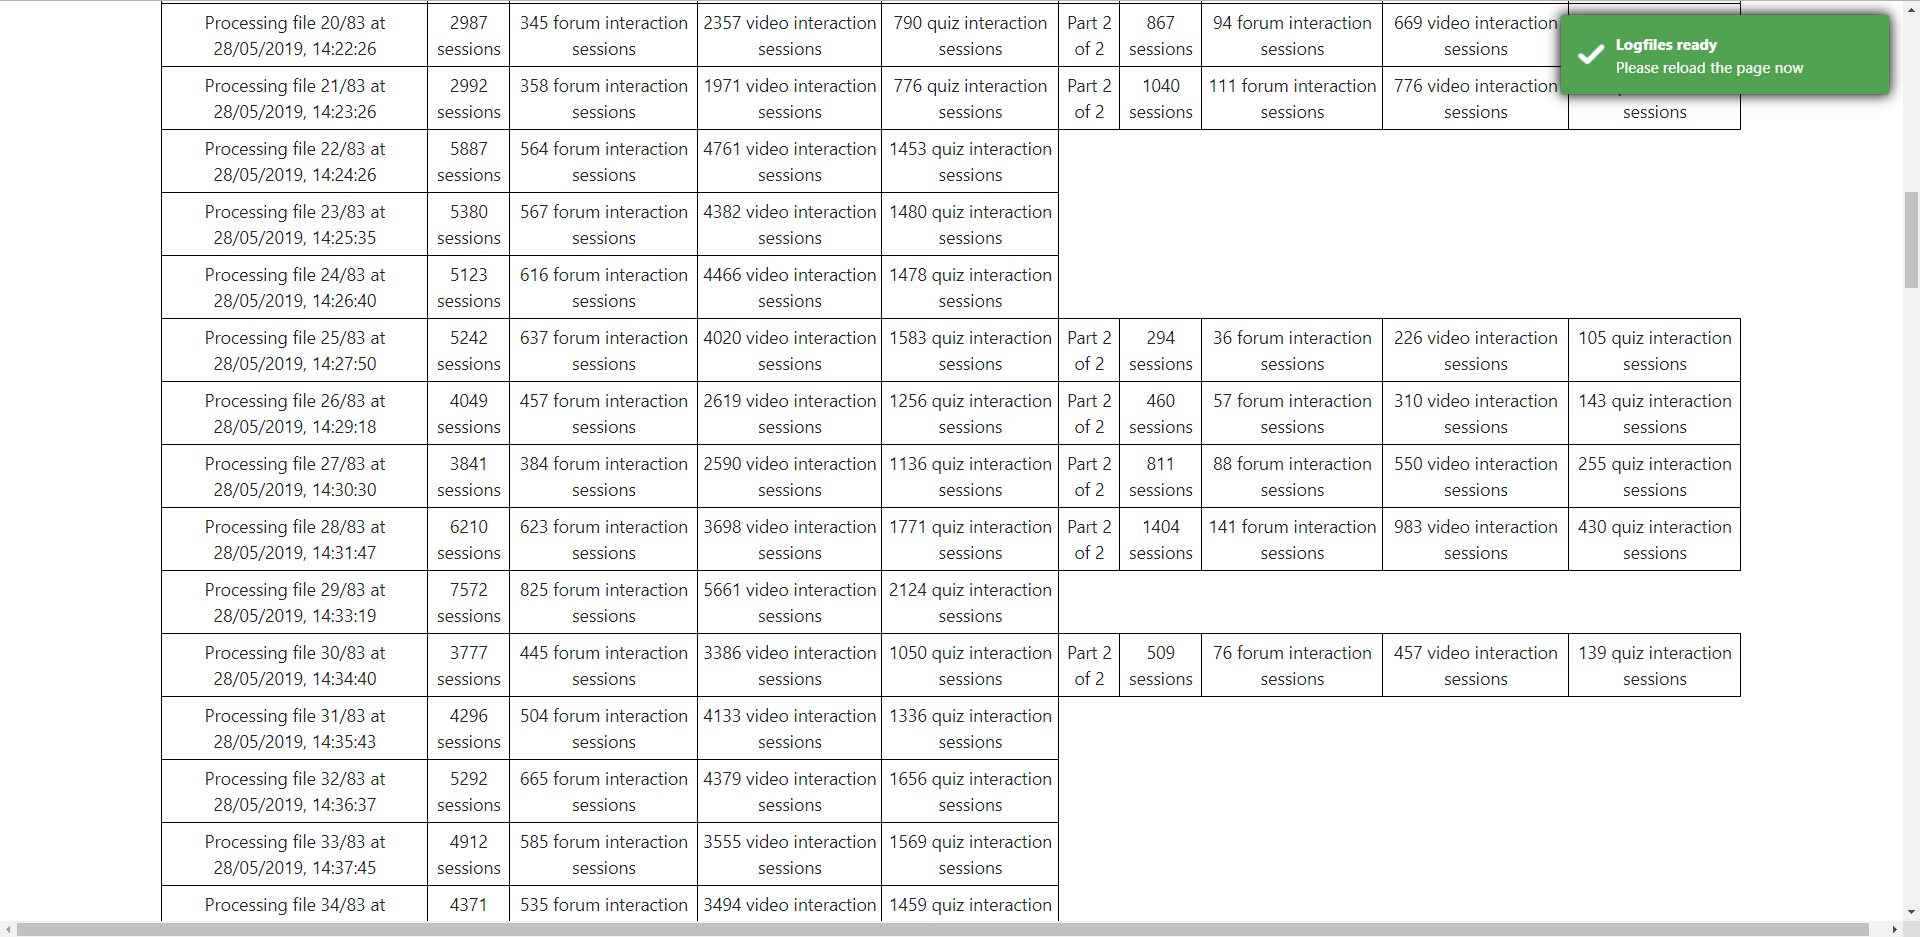
Once the log processing is done, ELAT will prompt again to reload the page.
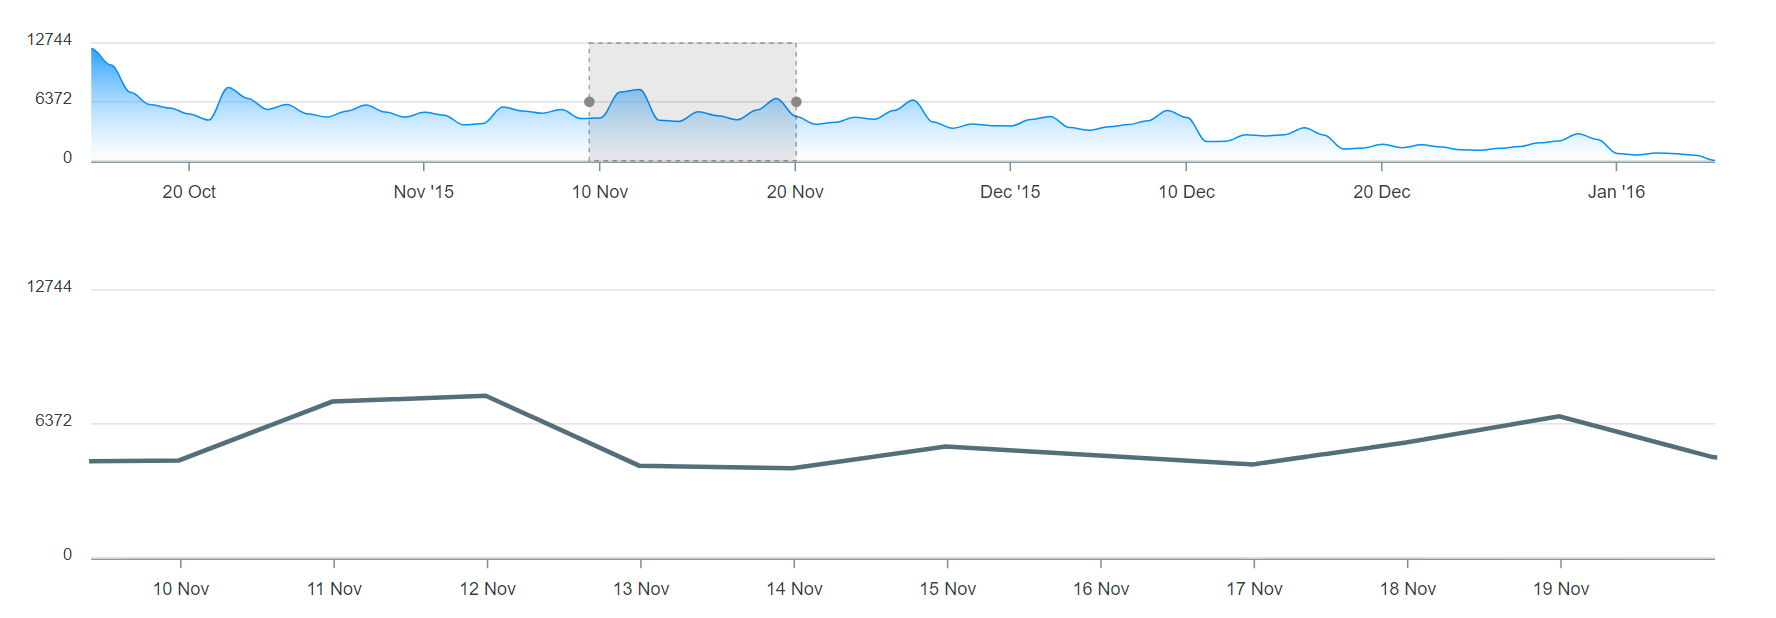
5. Dashboard: Indicators (Describe Indicators and Graphs)
When reloaded, it will automatically start processing indicators and graph data, updating with every step.
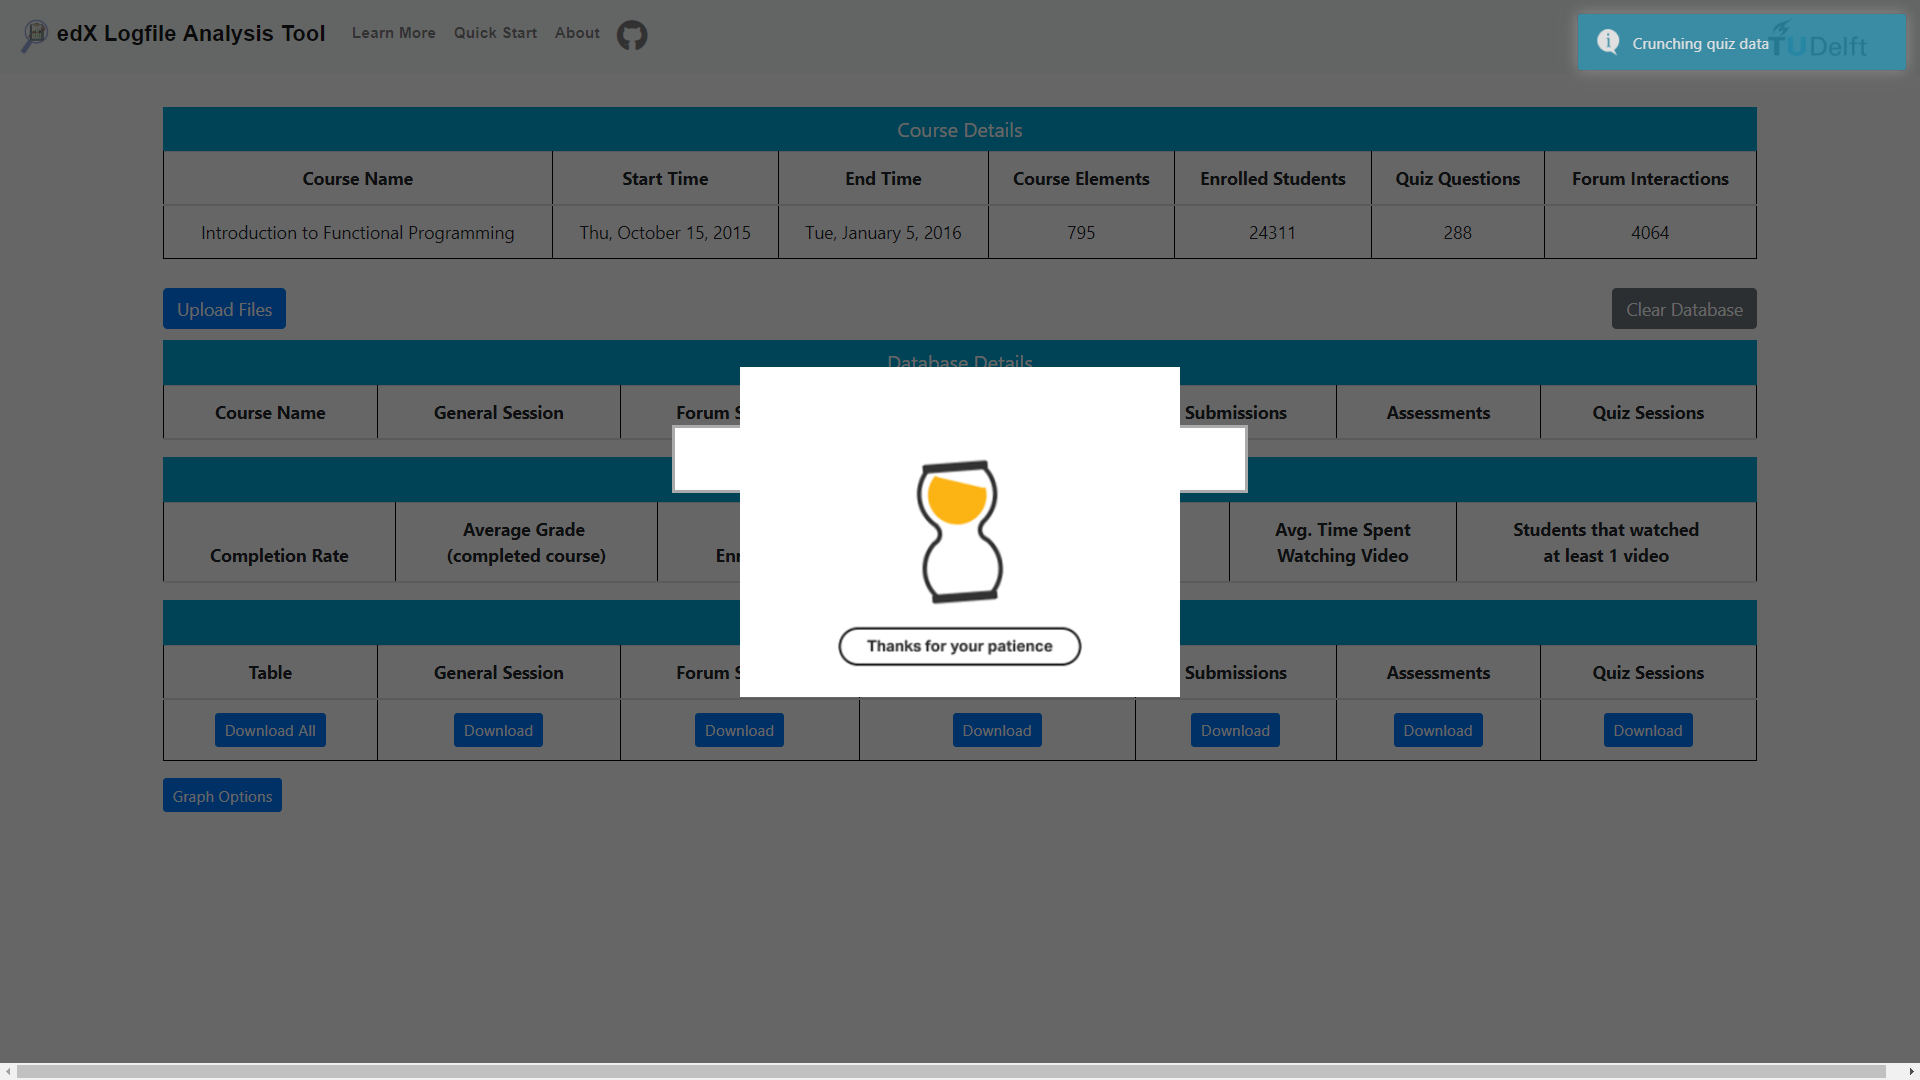
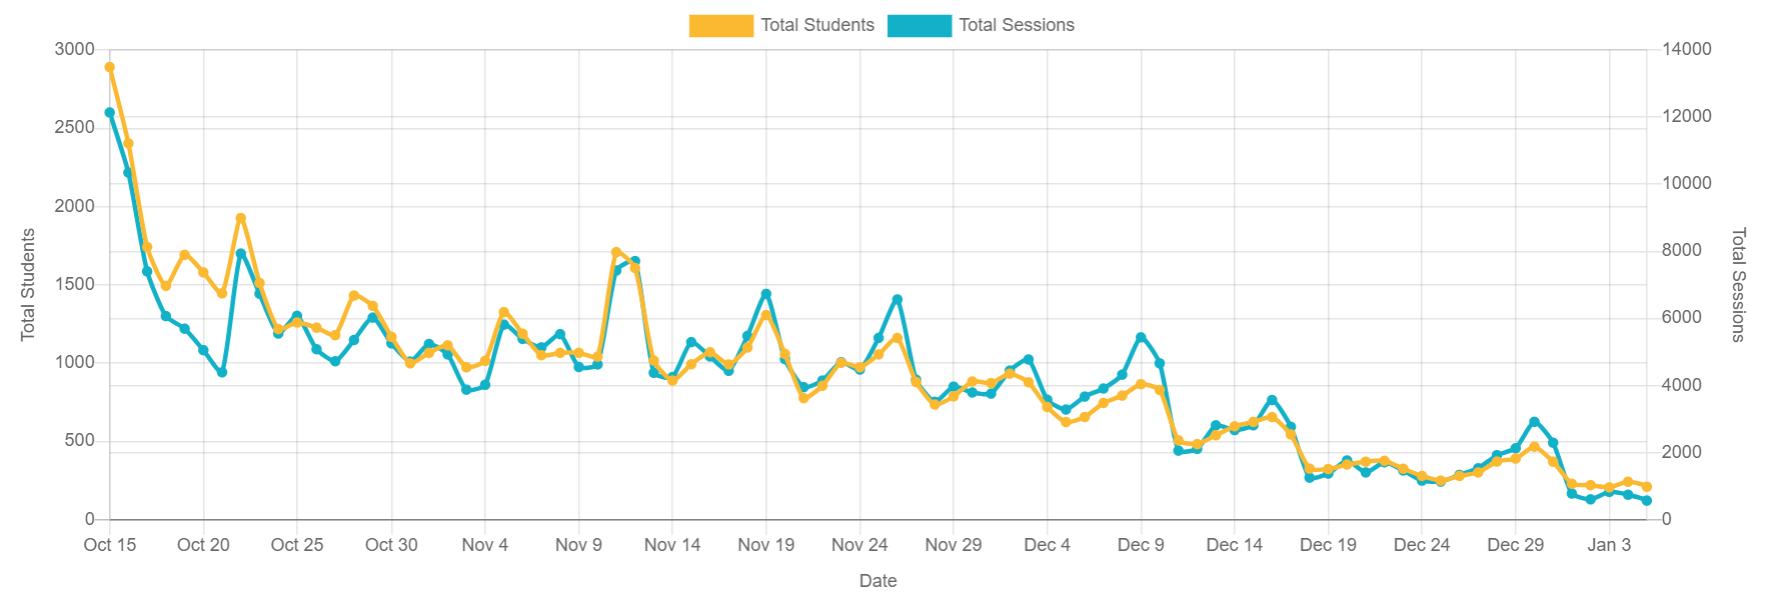
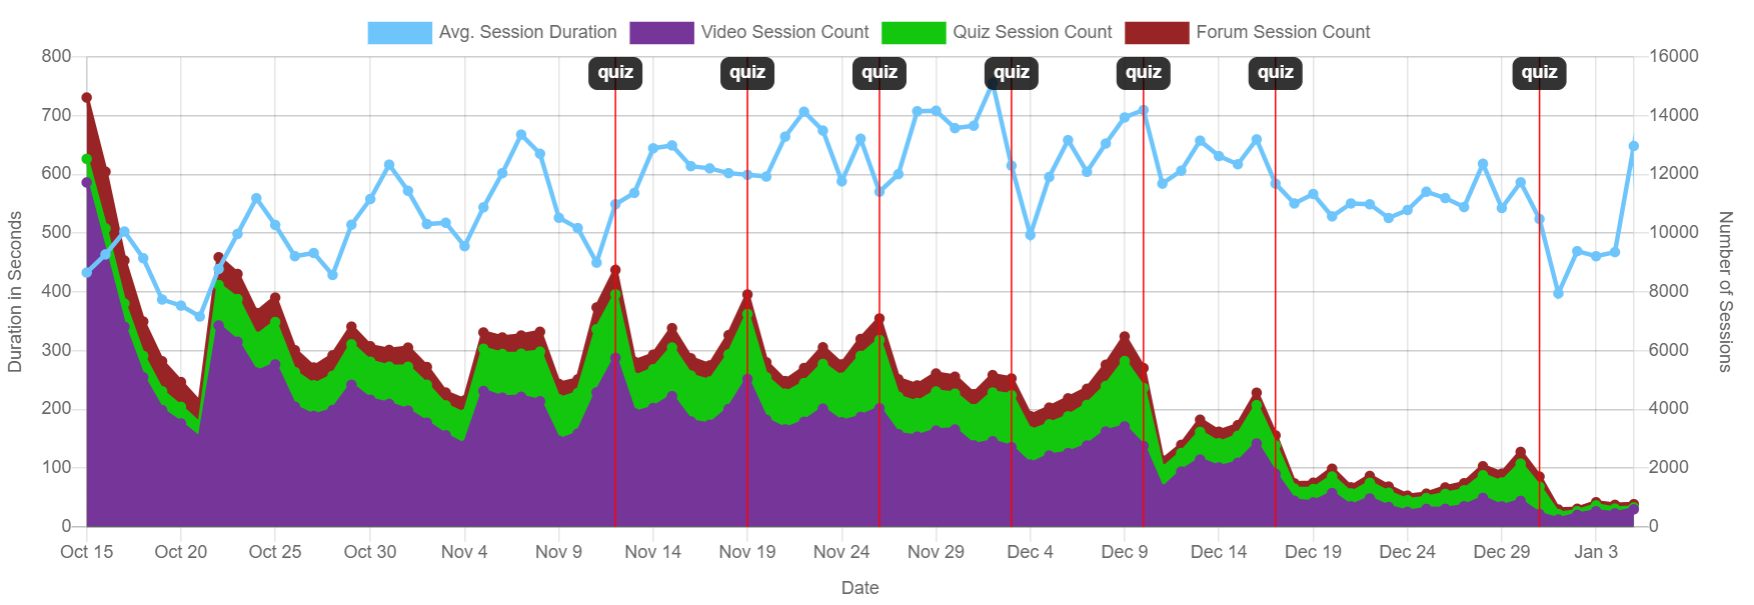
The values for Time Spent on Video and Students that Watched at Least one Video will be prepared, as well as the graphs.

6. Download Files
By pressing the corresponding button, ELAT will prepare the csv file(s) for download. The fields of each one are described in sessions
7. Delete
The button to delete everything is located under the Course Details table. If confirmed, it will delete all the information, tables and schema from your machine. This allows to start the process again, with a new course for example.

